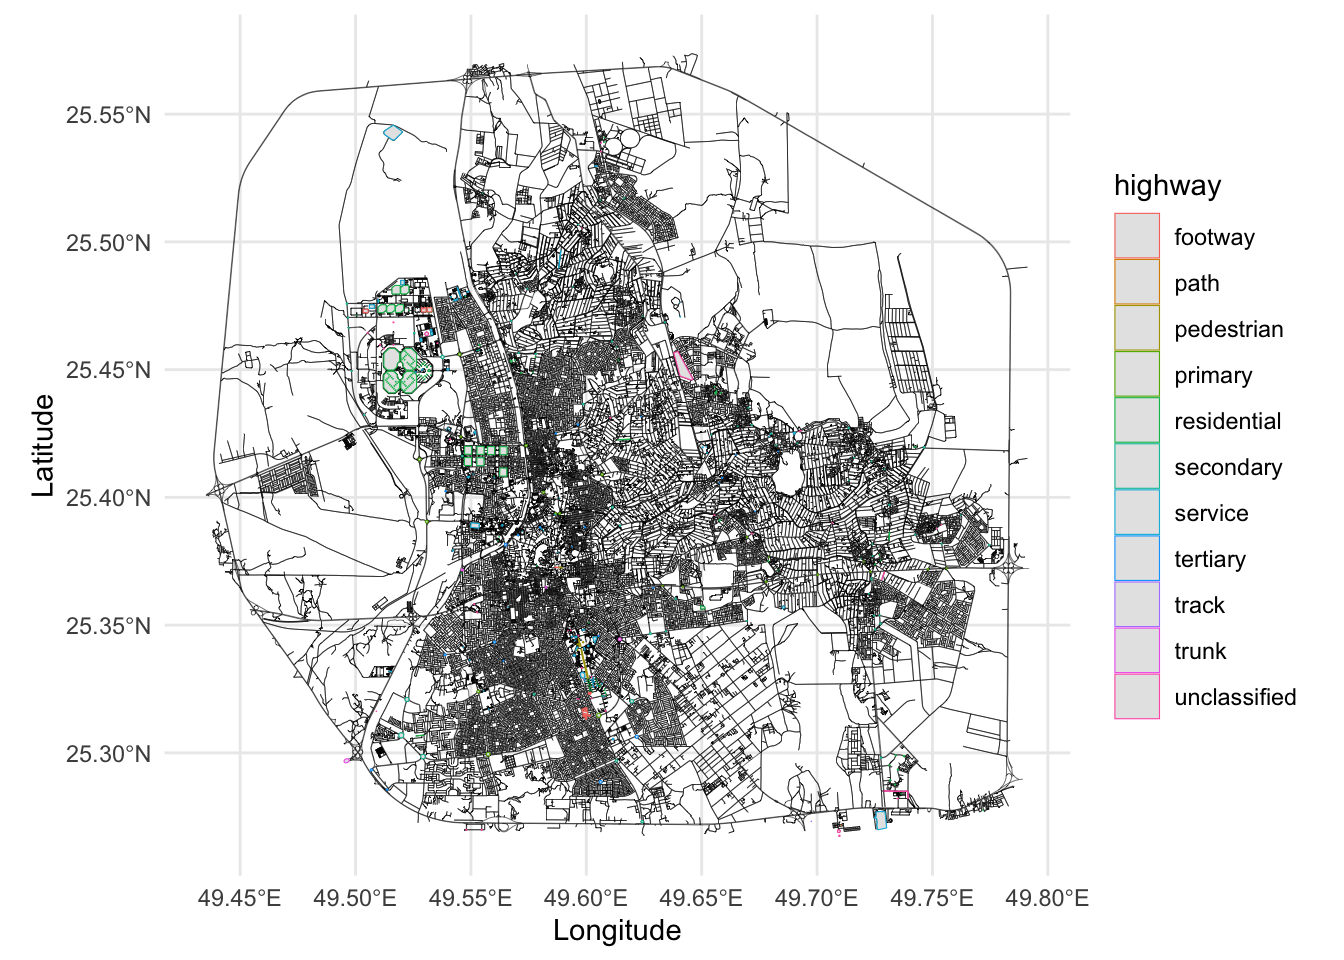
In this section, we extract the locations of spatial covariates from OpenStreetMap data. We collect the positions of mosques, educational institutions, hospitals, financial institutions (banks and ATMs), and road intersections within the study area. The distance computations and transformations are covered in the next section (Computing Spatial Covariates).

1 Extracting the Spatial Covariates

We will now create `additional_city_objects.RData’ file that contains the spatial covariates. We will extract the following spatial covariates: mosques, education places, hospital places, finance places, and intersections.

library(osmdata)
library(sf)
library(MetricGraph)
library(rSPDE)
library(INLA)
library(qs)
library(ggplot2)
library(leaflet)
library(dplyr)
library(here)

# Define the CRS using the WKT string
crs_wkt <- 'GEOGCRS["unknown",
    DATUM["World Geodetic System 1984",
        ELLIPSOID["WGS 84",6378137,298.257223563,
            LENGTHUNIT["metre",1]],
        ID["EPSG",6326]],
    PRIMEM["Greenwich",0,
        ANGLEUNIT["degree",0.0174532925199433],
        ID["EPSG",8901]],
    CS[ellipsoidal,2],
        AXIS["longitude",east,
            ORDER[1],
            ANGLEUNIT["degree",0.0174532925199433,
                ID["EPSG",9122]]],
        AXIS["latitude",north,
            ORDER[2],
            ANGLEUNIT["degree",0.0174532925199433,
                ID["EPSG",9122]]]]'

# Create the CRS object
new_crs <- st_crs(crs_wkt)

# Read the polygon data and set the new CRS
polygon <- st_read(here("Data/center_ahsa_polygon.geojson")) %>%
  st_cast("POLYGON") %>%
  st_set_crs(new_crs)
## Reading layer `center_ahsa_polygon' from data source 
##   `/Users/saduakd/Documents/GraphLGCP/Data/center_ahsa_polygon.geojson' 
##   using driver `GeoJSON'
## Simple feature collection with 1 feature and 1 field
## Geometry type: MULTIPOLYGON
## Dimension:     XY
## Bounding box:  xmin: 49.43056 ymin: 25.26735 xmax: 49.79261 ymax: 25.57398
## Geodetic CRS:  WGS 84
bb <- st_bbox(polygon)

# Visualize the polygon boundary
leaflet() %>%
  addProviderTiles("CartoDB.Positron") %>%
  addPolygons(data = polygon, color = "red", fill = FALSE, weight = 2)
# Load graph
graph <- qread(here("Data/graph_mesh_pruned_50m_7FRC.qs"))

1.1 Highways and Intersections

####### EXPLORING available OSM Data #######
data_width = opq(bb = bb) %>%
  add_osm_feature(key = "width") %>%
  osmdata_sf() 

## HIGHWAY
tags_highway <- available_tags("highway")
data_highway <- opq(bb = bb) %>%
  add_osm_feature(key = "highway", value = tags_highway$Value) %>%
  osmdata_sf()

points_highway <- data_highway$osm_points %>%
  filter(!is.na(highway)) %>%
  select(geometry, highway)
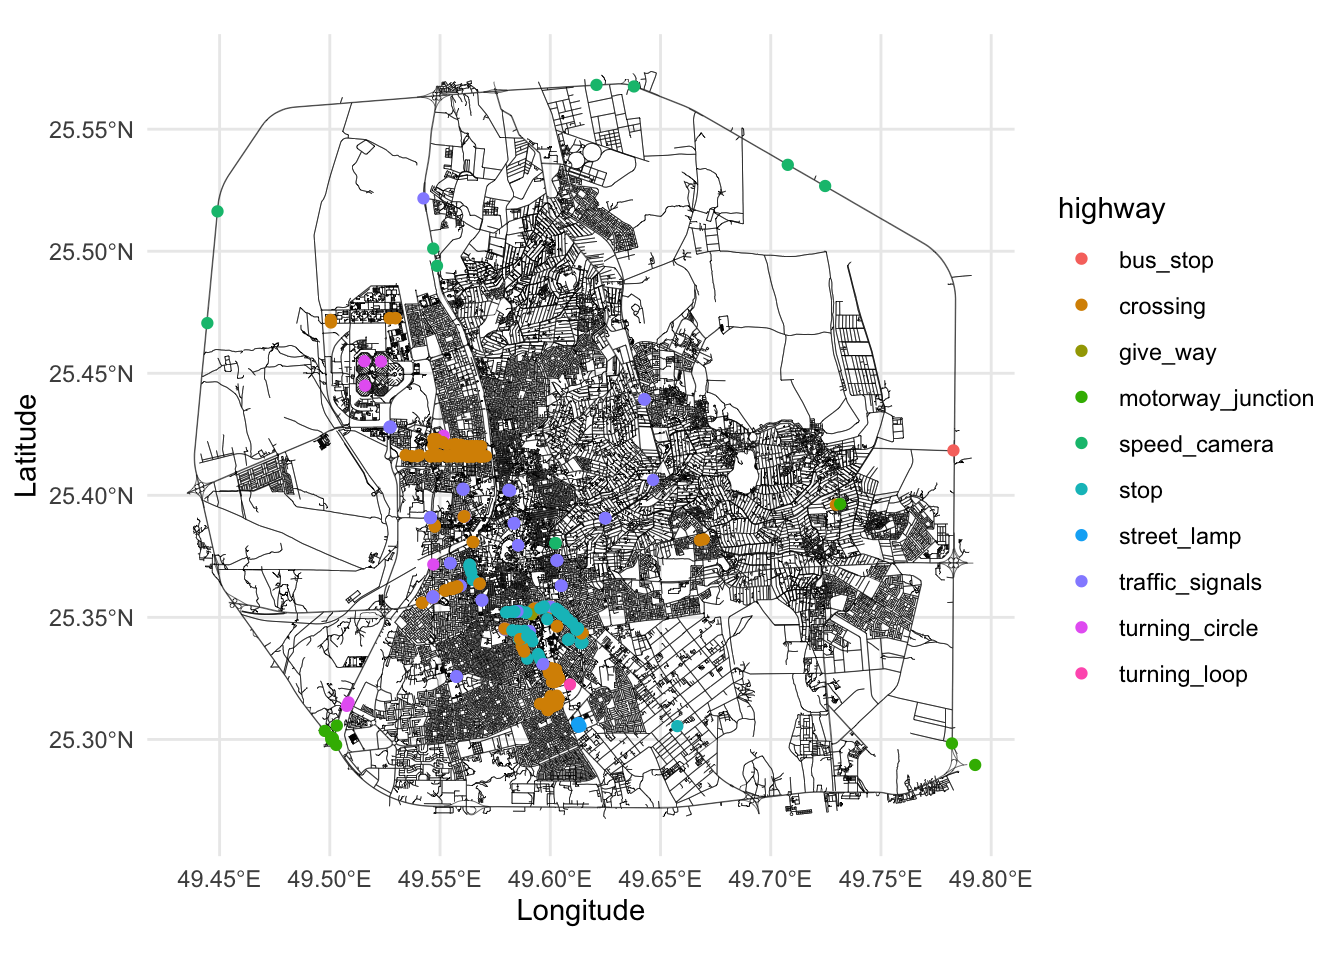
table(points_highway$highway)
## 
##          bus_stop          crossing          give_way motorway_junction 
##                 1               207                 5                10 
##      speed_camera              stop       street_lamp   traffic_signals 
##                10                70                 4                85 
##    turning_circle      turning_loop 
##                 7                 1
graph$plot(vertex_size = 0, edge_width = 0.1) +
  geom_sf(data = points_highway, aes(color = highway)) +
  theme_minimal()

# discard street_lamp
points_highway <- points_highway %>% filter(highway != "street_lamp")

lines_highway <- data_highway$osm_lines %>%
  filter(!is.na(highway)) %>%
  select(geometry, highway)
table(lines_highway$highway)
## 
##   construction         escape        footway  living_street       motorway 
##             75              2            329            134              2 
##  motorway_link           path     pedestrian        primary   primary_link 
##              9             18             34            170             81 
##       proposed    residential      secondary secondary_link        service 
##              2          13742            566            104           4030 
##          steps       tertiary  tertiary_link          track          trunk 
##              6            626             72            113            135 
##     trunk_link   unclassified 
##            112           1622
polygon_highway <- data_highway$osm_polygons %>%
  filter(!is.na(highway)) %>%
  select(geometry, highway)
table(polygon_highway$highway)
## 
##      footway         path   pedestrian      primary  residential    secondary 
##            8            1            5           22          164           65 
##      service     tertiary        track        trunk unclassified 
##           79           23            1            5           39
graph$plot(vertex_size = 0, edge_width = 0.1) +
  geom_sf(data = polygon_highway, aes(color = highway)) +
  theme_minimal()

1.2 Leisure, Amenities, and Buildings

## LEISURE
tags_leisure <- available_tags("leisure")
data_leisure <- opq(bb = bb) %>%
  add_osm_feature(key = "leisure", value = tags_leisure$Value) %>%
  osmdata_sf()
points_leisure <- data_leisure$osm_points %>%
  filter(!is.na(leisure)) %>%
  select(geometry, leisure)
table(points_leisure$leisure)
## 
## amusement_arcade   fitness_centre     horse_riding             park 
##                1                2                1                4 
##     picnic_table            pitch       playground          stadium 
##                3                3               35                1
polygon_leisure <- data_leisure$osm_polygons %>%
  filter(!is.na(leisure)) %>%
  select(geometry, leisure)
table(polygon_leisure$leisure)
## 
##        garden          park         pitch    playground sports_centre 
##             4            96           108             3            13 
##       stadium swimming_pool         track 
##             5             2             2
## AMENITY
tags_amenity <- available_tags("amenity")
data_amenity <- opq(bb = bb) %>%
  add_osm_feature(key = "amenity", value = tags_amenity$Value) %>%
  osmdata_sf()
## Error in `httr2::req_perform()`:
## ! HTTP 504 Gateway Timeout.
points_amenity <- data_amenity$osm_points %>%
  filter(!is.na(amenity)) %>%
  select(geometry, amenity)
## Error: object 'data_amenity' not found
table(points_amenity$amenity)[order(table(points_amenity$amenity), decreasing = TRUE)]
## Error: object 'points_amenity' not found
## BUILDING
tags_building <- available_tags("building")
data_building <- opq(bb = bb,timeout = 300) %>%
  add_osm_feature(key = "building") %>%
  osmdata_sf()

points_building <- data_building$osm_points %>%
  filter(!is.na(building)) %>%
  select(geometry, building)
table(points_building$building)[order(table(points_building$building), decreasing = TRUE)]
## 
##     mosque     bunker        yes industrial     school 
##         16          3          2          1          1
polygon_building <- data_building$osm_polygons %>%
  filter(!is.na(building)) %>%
  select(geometry, building)
table(polygon_building$building)[order(table(polygon_building$building), decreasing = TRUE)]
## 
##            yes          house        college           barn      dormitory 
##           3881            182             37             25             16 
##         school      warehouse           roof         mosque         retail 
##             16             15             13             12             12 
##     university     apartments       hospital     commercial        stadium 
##              9              5              4              3              3 
##        parking   construction      religious        service  sports_centre 
##              2              1              1              1              1 
##  train_station transportation 
##              1              1

1.3 Main Functions

######### EXTRACTING Specific Amenities #########
remove_duplicates_within_threshold <- function(data, threshold) {
    # Convert the distance threshold to meters
    distance_threshold <- units::set_units(threshold, "meters")

    # Identify pairs of points that are within the distance threshold
    within_distance <- st_is_within_distance(data, data, dist = distance_threshold)
    keep <- rep(TRUE, length(within_distance))

    # Loop through each point and mark duplicates for removal
    for (i in seq_along(within_distance)) {
      if (keep[i]) {
        duplicates <- within_distance[[i]]
        # Mark all duplicates (excluding the current point) for removal
        if (length(duplicates) > 1) {
          keep[duplicates[-1]] <- FALSE
        }
      }
    }
    unique_data <- data[keep, ]
    return(unique_data)
  }


# Fetch OSM data for both points and polygons
fetch_osm_data <- function(key, value, bb) {
  # Fetch points data and check if it exists
  data_points <- tryCatch({
    opq(bb = bb,timeout = 300) %>%
      add_osm_feature(key = key, value = value) %>%
      osmdata_sf() %>%
      .$osm_points %>%
     # filter(!is.na(!!sym(key))) %>%
      select(geometry, !!sym(key))
  }, error = function(e) {
    NULL  # Return NULL if points data is not available
  })

  # Fetch polygons data and check if it exists
  data_polygons <- tryCatch({
    opq(bb = bb, timeout = 300) %>%
      add_osm_feature(key = key, value = value) %>%
      osmdata_sf() %>%
      .$osm_polygons %>%
     # filter(!is.na(!!sym(key))) %>%
      select(geometry, !!sym(key))
  }, error = function(e) {
    NULL  # Return NULL if polygons data is not available
  })

  # Check if both points and polygons data are available
  if (is.null(data_points) && is.null(data_polygons)) {
    return(NULL)  # Skip if no data available
  }

  # Convert polygons to points (centroids) if polygons are available
  if (!is.null(data_polygons) && nrow(data_polygons) > 0) {
    centroids_polygons <- st_centroid(data_polygons) %>%
      select(geometry, !!sym(key))
  } else {
    centroids_polygons <- NULL
  }

  # Combine points and centroids if both are available
  if (!is.null(data_points) && nrow(data_points) > 0 && !is.null(centroids_polygons)) {
    combined <- rbind(data_points, centroids_polygons)
  } else if (!is.null(data_points) && nrow(data_points) > 0) {
    combined <- data_points
  } else {
    combined <- centroids_polygons
  }

  # Check that only the value of interest is present
 # combined <- combined %>% filter(!!sym(key) == value)
  combined <- combined %>% filter(!!sym(key) == value | is.na(!!sym(key)))
  unique_combined = remove_duplicates_within_threshold(combined, 100)

  return(unique_combined)
}
1.4 Extracting the Amenities

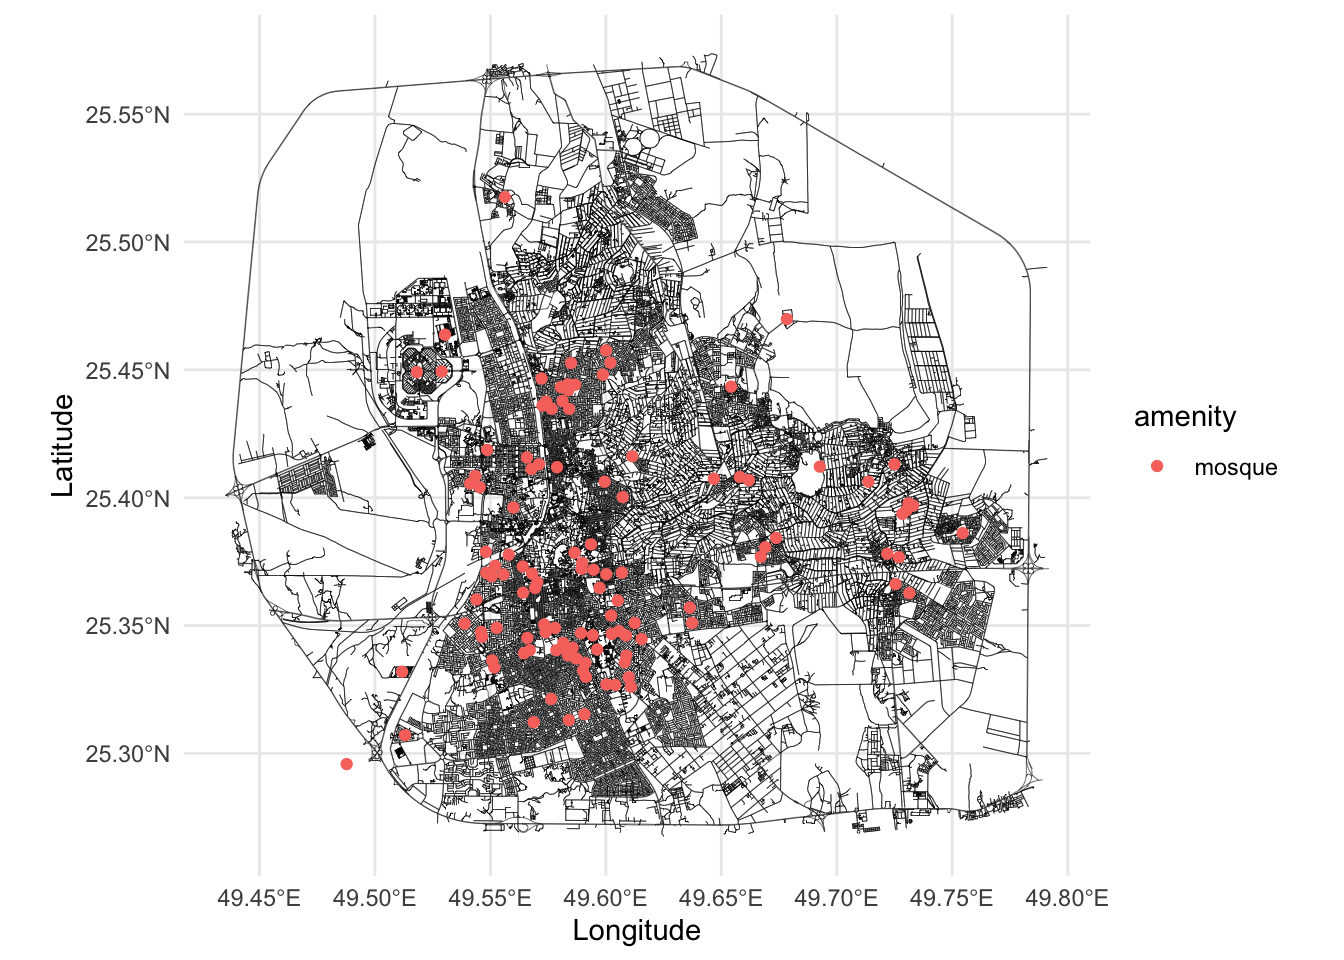
# MOSQUES  
mosques = fetch_osm_data("amenity", "place_of_worship", bb)
mosques2 = fetch_osm_data("building", "mosque", bb)

mosques2 = mosques2 %>% rename(amenity = building)
mosques = rbind(mosques, mosques2)
mosques$amenity = "mosque"
mosques = remove_duplicates_within_threshold(mosques, 200)
cat("The number of unique mosques is", nrow(mosques), "\n")
## The number of unique mosques is 116
graph$plot(vertex_size = 0, edge_width = 0.1) +
    geom_sf(data = mosques, aes(color = amenity)) +
    theme_minimal()

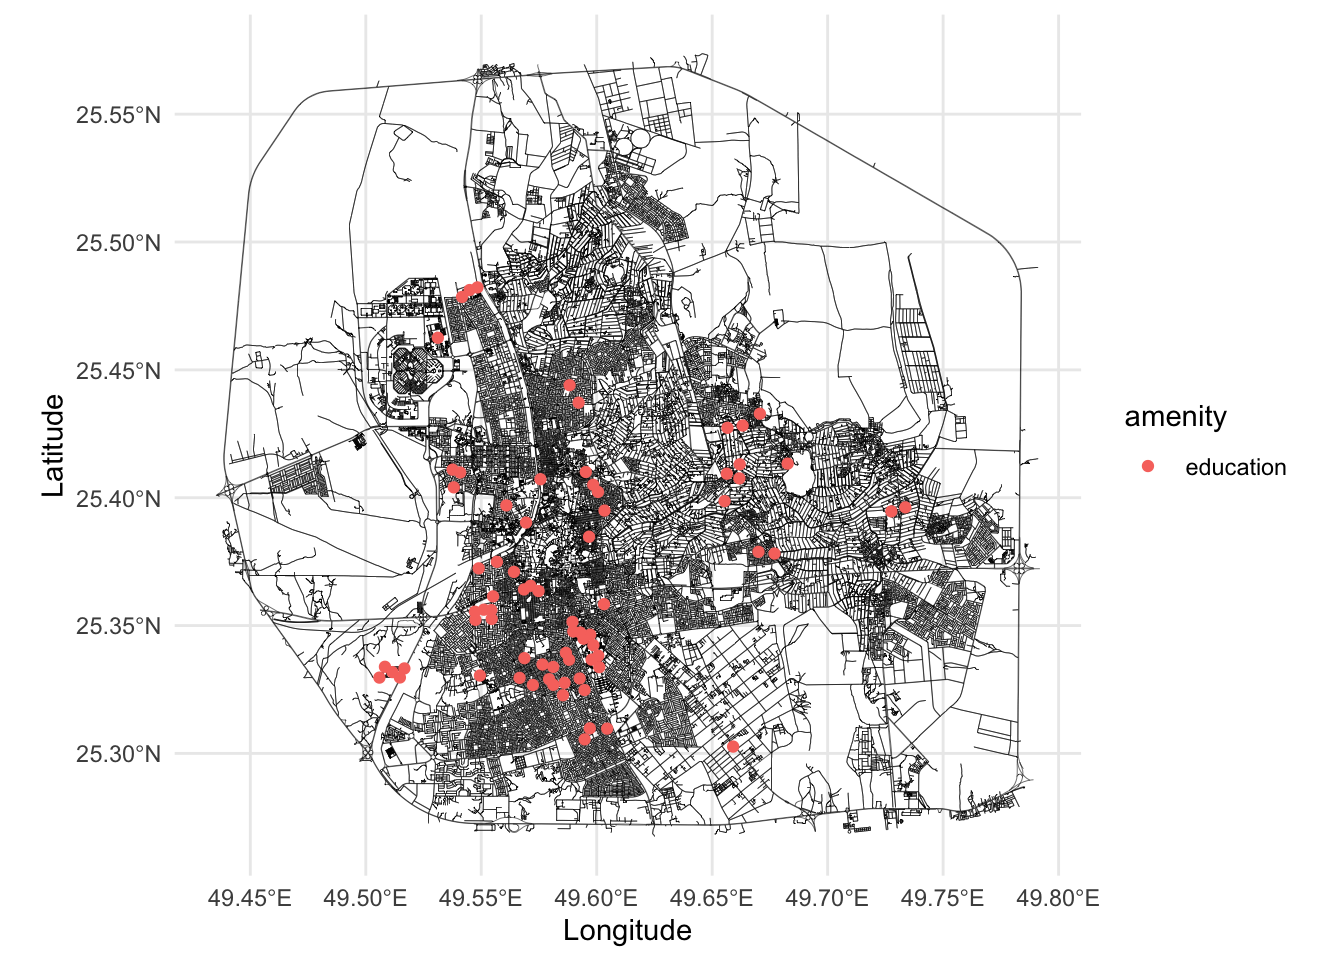
# EDUCATION
college = fetch_osm_data("amenity", "college", bb)
college2 = fetch_osm_data("building", "college", bb)
school = fetch_osm_data("amenity", "school", bb)
school2 = fetch_osm_data("building", "school", bb)
kindergarten = fetch_osm_data("amenity", "kindergarten", bb)
library = fetch_osm_data("amenity", "library", bb)
university = fetch_osm_data("amenity", "university", bb)
university2 = fetch_osm_data("building", "university", bb)

# Merge all the education data and check the number of unique points
education = rbind(college, school, kindergarten, library, university)
education2 = rbind(college2, school2, university2)%>% rename(amenity = building)
education = rbind(education, education2)
education$amenity = "education"
education_places = remove_duplicates_within_threshold(education, 300)
cat("The number of unique education points is", nrow(education_places), "\n")
## The number of unique education points is 74
graph$plot(vertex_size = 0, edge_width = 0.1) +
    geom_sf(data = education_places, aes(color = amenity)) +
    theme_minimal()

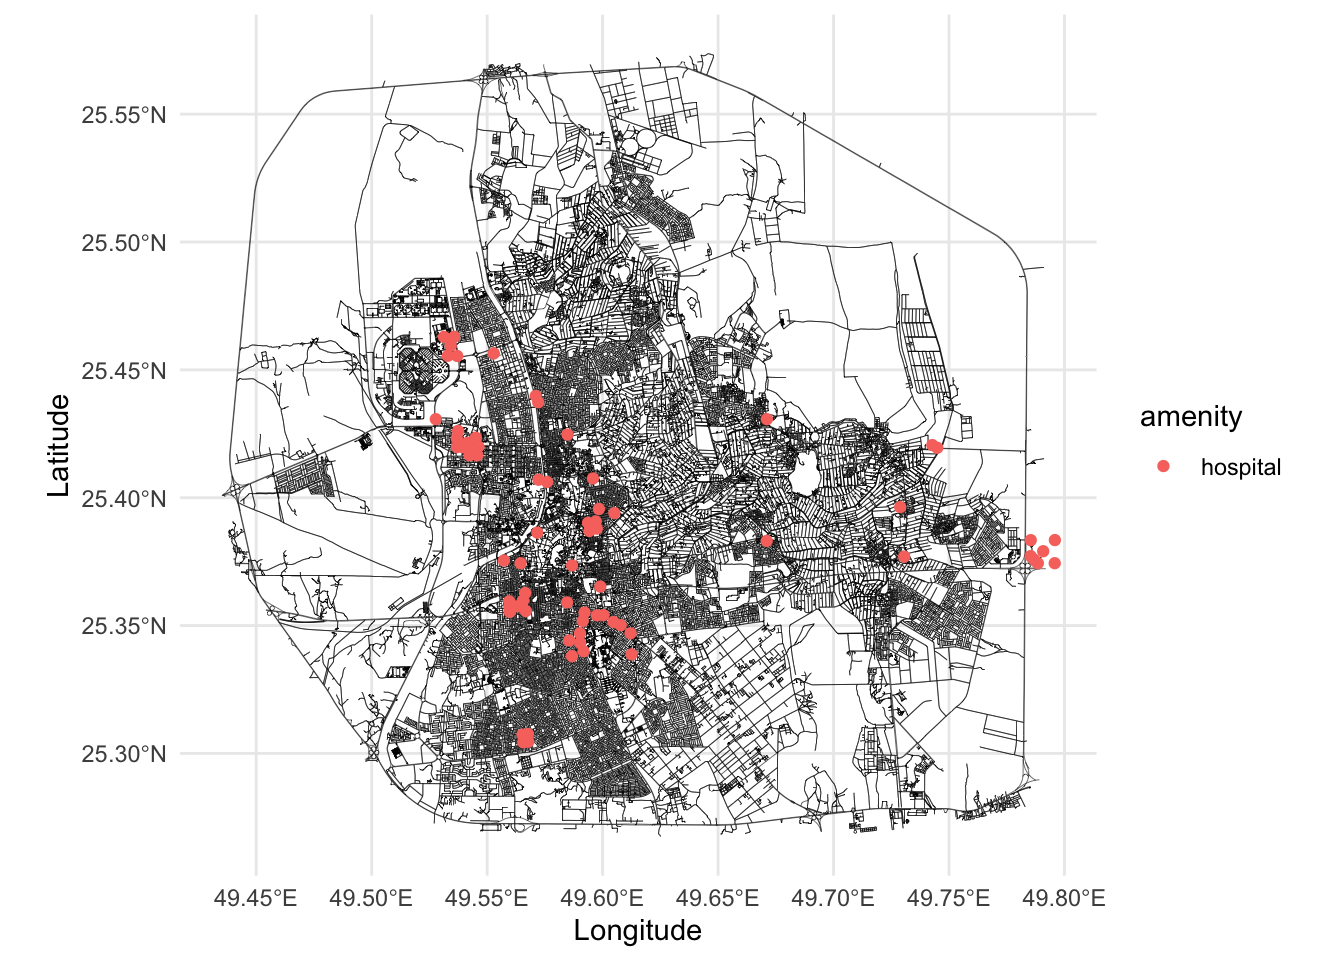
# HEALTH
hospital = fetch_osm_data("amenity", "hospital", bb)
hospital2 = fetch_osm_data("building", "hospital", bb)
clinic = fetch_osm_data("amenity", "clinic", bb)
dentist = fetch_osm_data("amenity", "dentist", bb)
doctors = fetch_osm_data("amenity", "doctors", bb)
pharmacy = fetch_osm_data("amenity", "pharmacy", bb)

hospitals = rbind(hospital, clinic, dentist, doctors, pharmacy)
hospitals2 = hospital2 %>% rename(amenity = building)
hospitals= rbind(hospitals, hospitals2)
hospitals$amenity = "hospital"
hospital_places = remove_duplicates_within_threshold(hospitals, 200)
cat("The number of unique hospital points is", nrow(hospitals), "\n")
## The number of unique hospital points is 87
graph$plot(vertex_size = 0, edge_width = 0.1) +
    geom_sf(data = hospital_places, aes(color = amenity)) +
    theme_minimal()

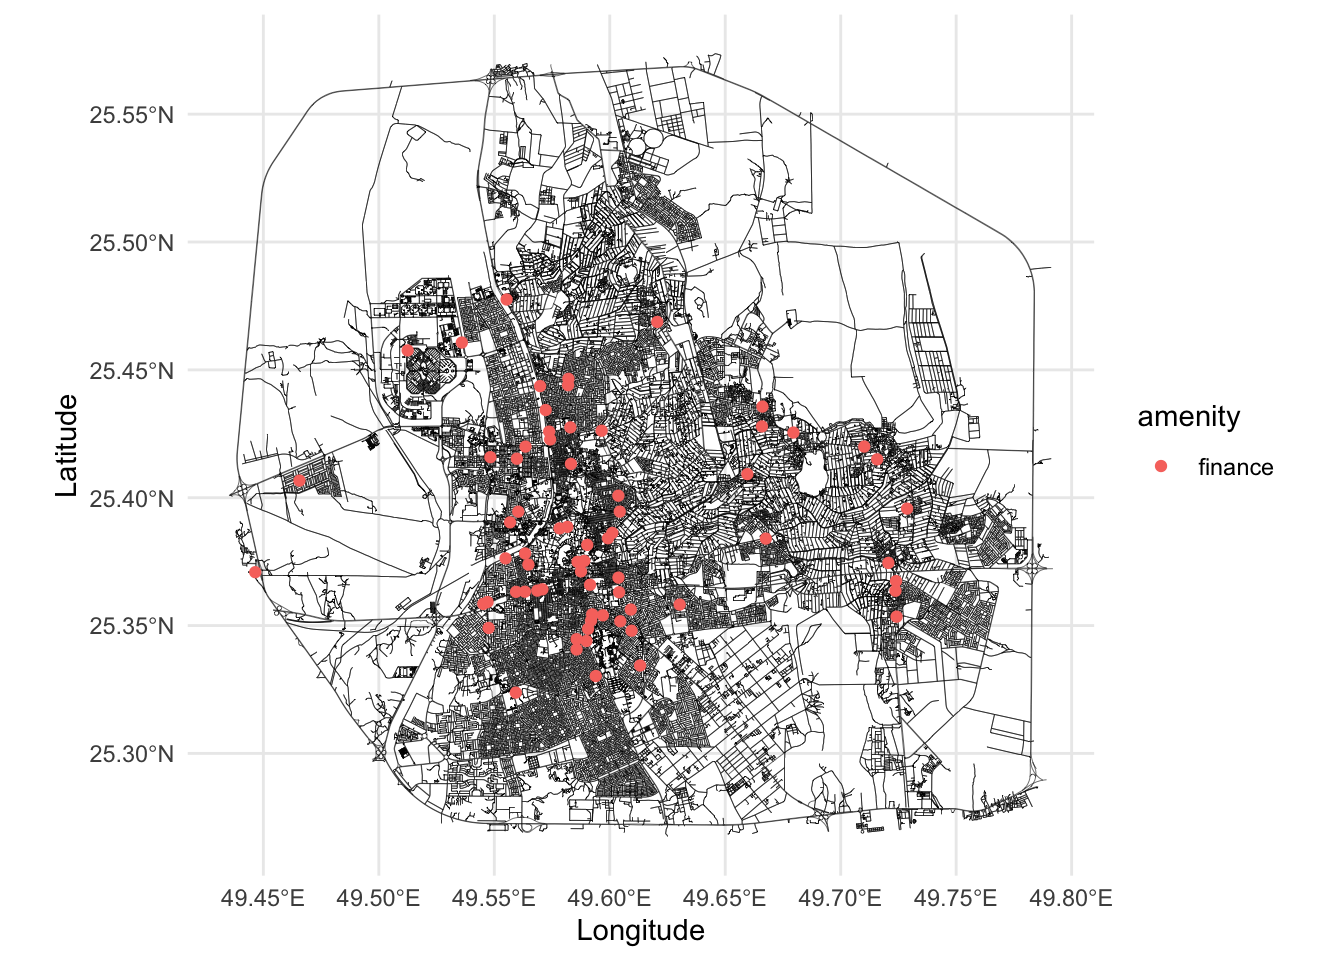
# FINANCE
bank = fetch_osm_data("amenity", "bank", bb)
atm = fetch_osm_data("amenity", "atm", bb)

finance = rbind(bank, atm)
finance$amenity = "finance"
finance_places = remove_duplicates_within_threshold(finance, 200)
cat("The number of unique finance points is", nrow(finance_places), "\n")
## The number of unique finance points is 69
graph$plot(vertex_size = 0, edge_width = 0.1) +
    geom_sf(data = finance_places, aes(color = amenity)) +
    theme_minimal()

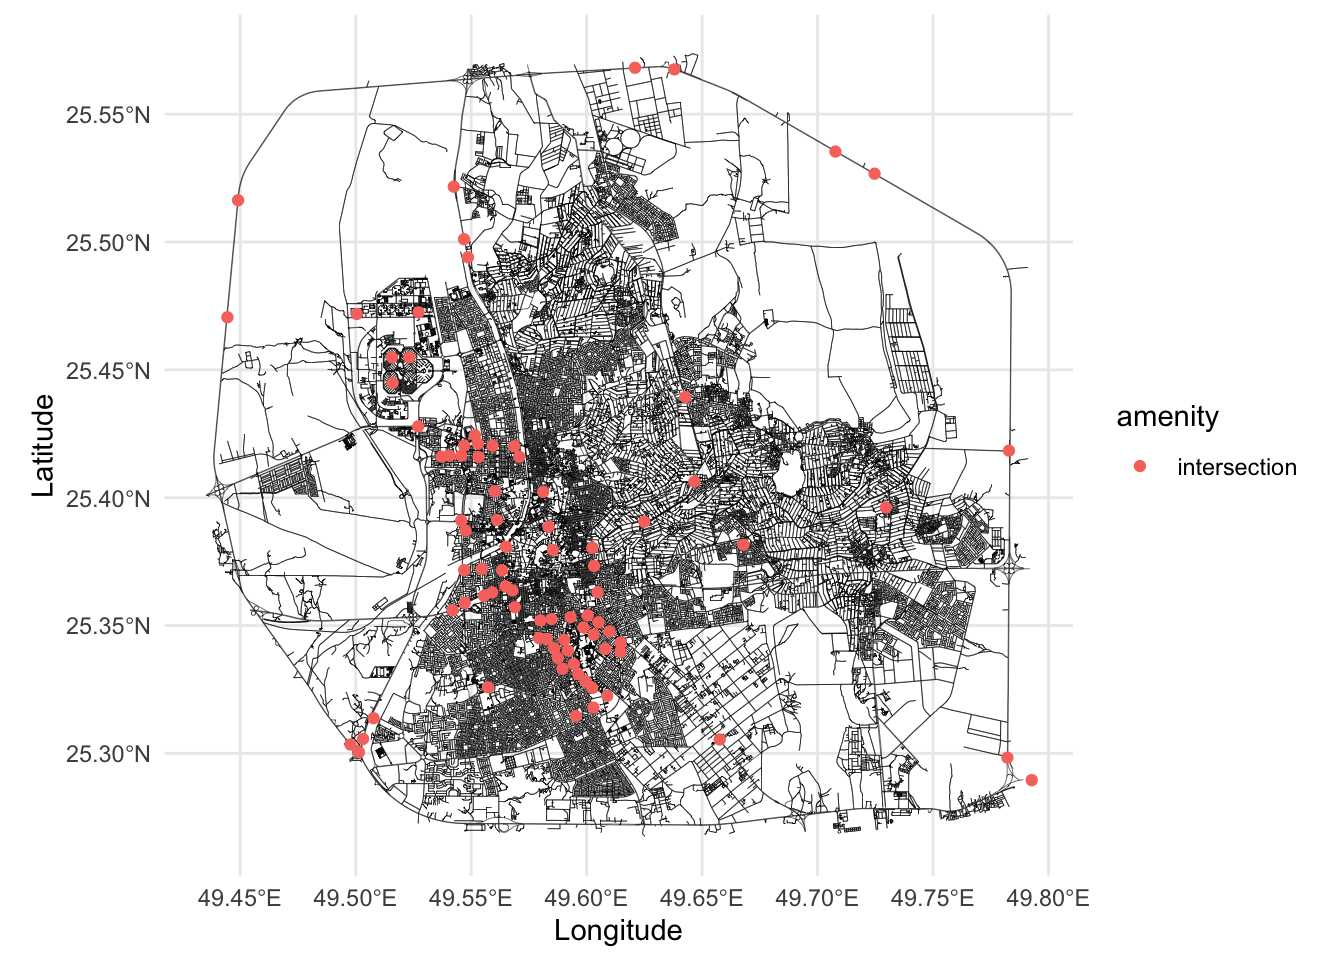
# JUNCTIONS
intersection = remove_duplicates_within_threshold(points_highway, 300)
# rename the column 
intersection = intersection %>% rename(amenity = highway)
intersection$amenity = "intersection"
graph$plot(vertex_size = 0, edge_width = 0.1) +
  geom_sf(data = intersection, aes(color = amenity)) +
  theme_minimal()

## Save all amenities data
save(mosques, education_places, hospital_places, finance_places, intersection, file = "Data/additional_city_objects.RData")
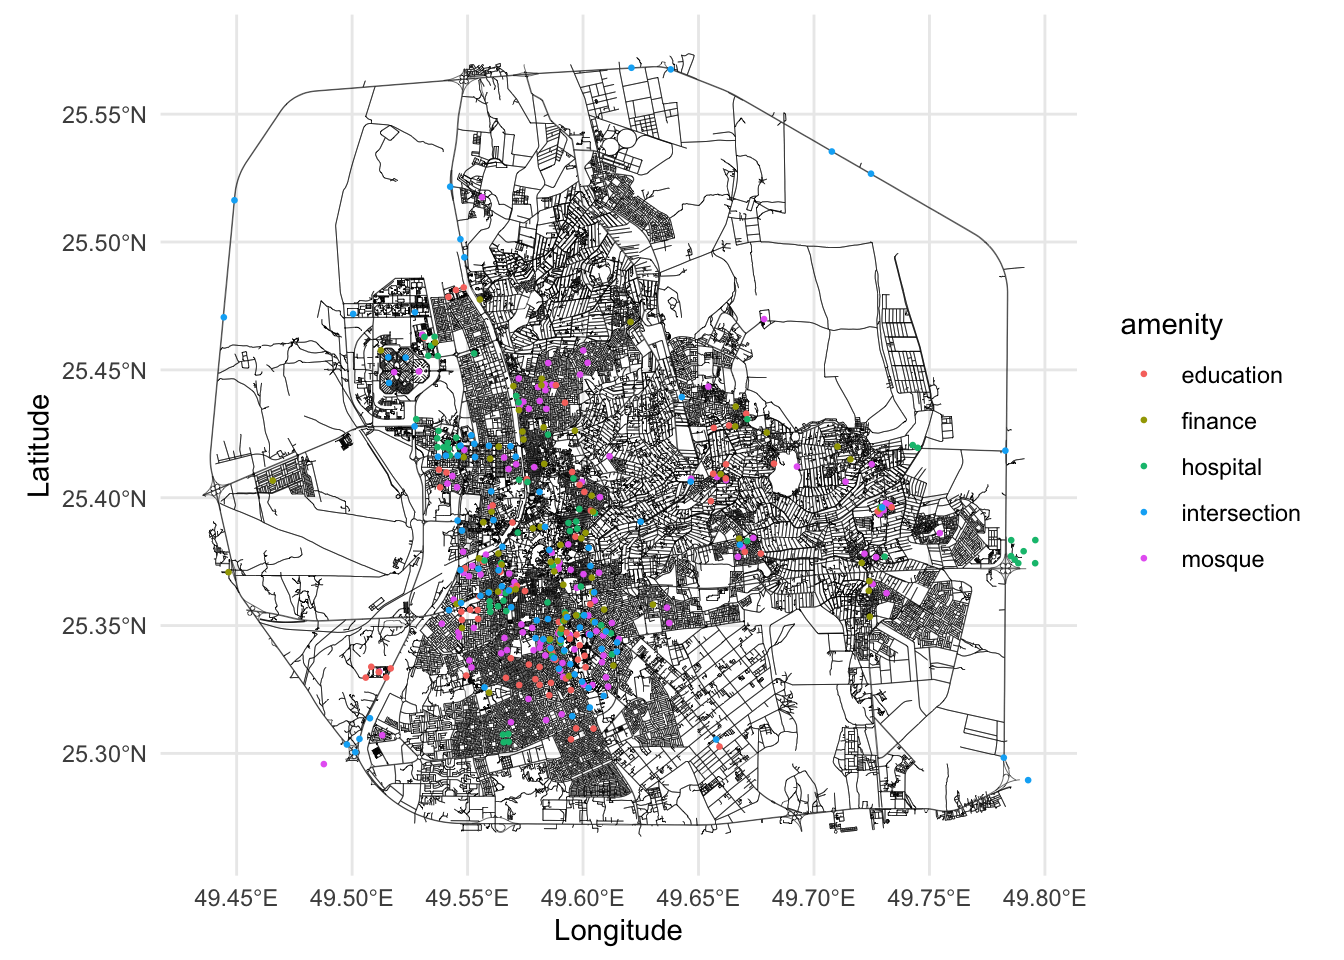
# Plot all amenities
graph$plot(vertex_size = 0, edge_width = 0.1) +
  geom_sf(data = mosques, aes(color = amenity), size = 0.5) +
  geom_sf(data = education_places, aes(color = amenity), size = 0.5) +
  geom_sf(data = hospital_places, aes(color = amenity), size = 0.5) +
  geom_sf(data = finance_places, aes(color = amenity), size = 0.5) +
  geom_sf(data = intersection, aes(color = amenity), size = 0.5) +
  theme_minimal()