Additional Maps
Last updated: February 04, 2025
This page will be updated soon to include more plot types.
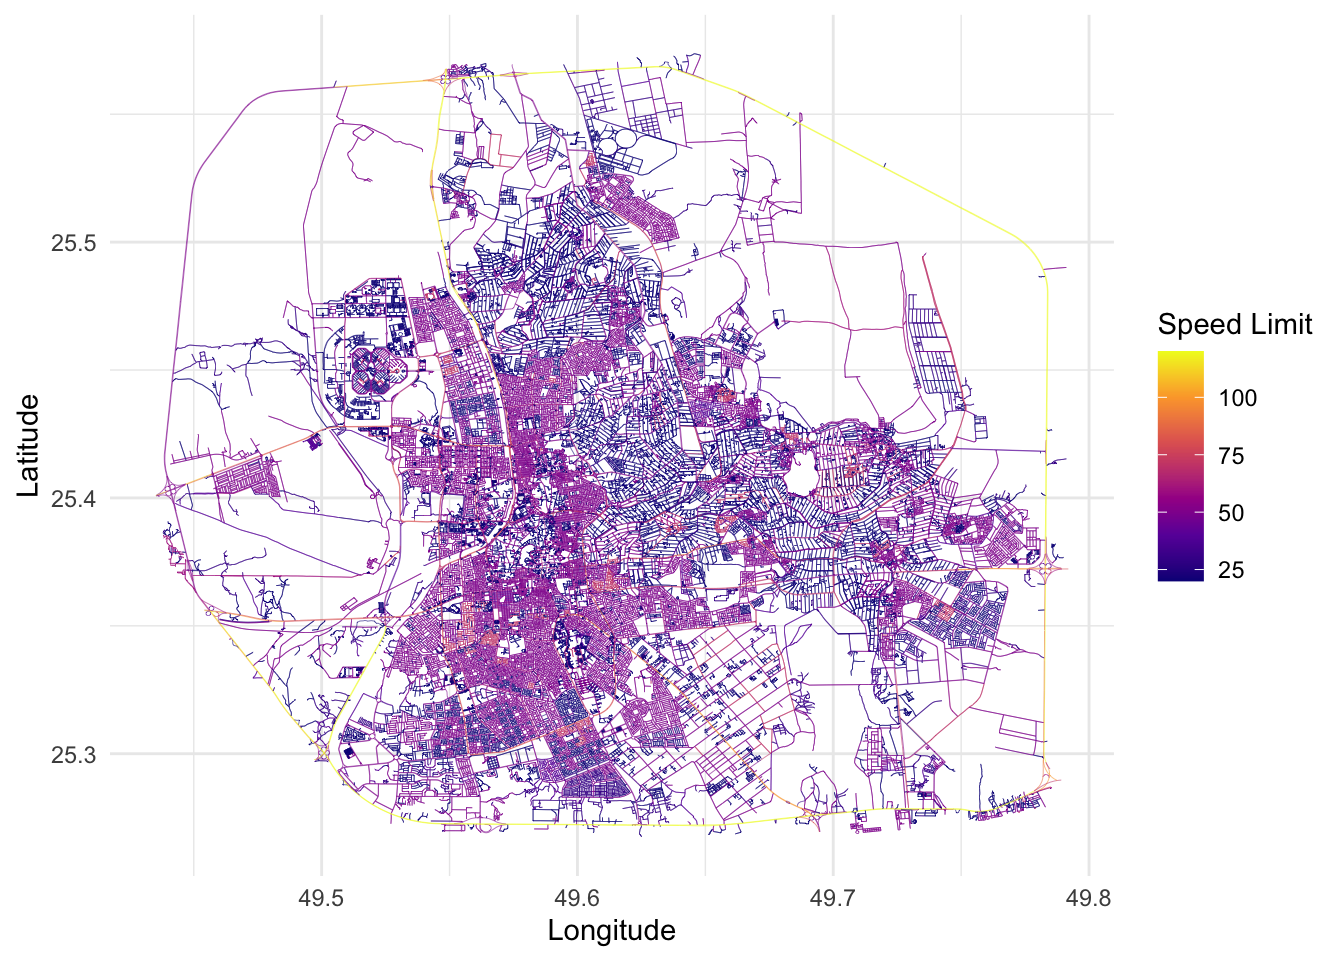
In this section, we will show additional plots that can be used to visualize the spatial distribution of the covariates along the network.
library(MetricGraph)
library(qs)
library(here)
library(ggplot2)
graph <- qread(here("Data/graph_mesh_pruned_100m_7FRC_ver2.qs"))
graph$plot(vertex_size = 0,
           edge_width = 0.1,
           edge_weight = "SpeedLimit",
           edge_color = "SpeedLimit",
           add_new_scale_weights = FALSE) +
  labs(color = "Speed Limit") +
theme_minimal()